Many people consider infographics the best option for presenting information in a fun and effective visual way at the same time. They are a delight for the of the viewer, but not as easy to make as they might seem even though there are many tools released every day to help us easily create better and better images including infographics for sharing and use in marketing projects, however, there are also many different types of infographics, so choosing and creating the right infographic becomes a difficult task, especially if you are still a beginner in infographic design.
So what to do instead?
One way to do it is to use the free pre made infographics you have or look for them on the internet, but soon you will find out that most of them are cheaply designed, won’t satisfy your taste and definitely won’t suit your presentation especially if you are looking forward making a catching and unforgettable one, then what else can you use? Premium infographics of course! But in this case, you will spend a long time looking for the best options and design, with some good amount of money too, but worry not! We have brought you the best PowerPoint infographics templates in the market with 30 wonderful infographic template that range from Timelines and Project status infographics to Digital Marketing infographics and even Mockups, let’s take a look at Nerkit the multipurpose PowerPoint infographics template!
1. Timeline Diagrams PowerPoint Template
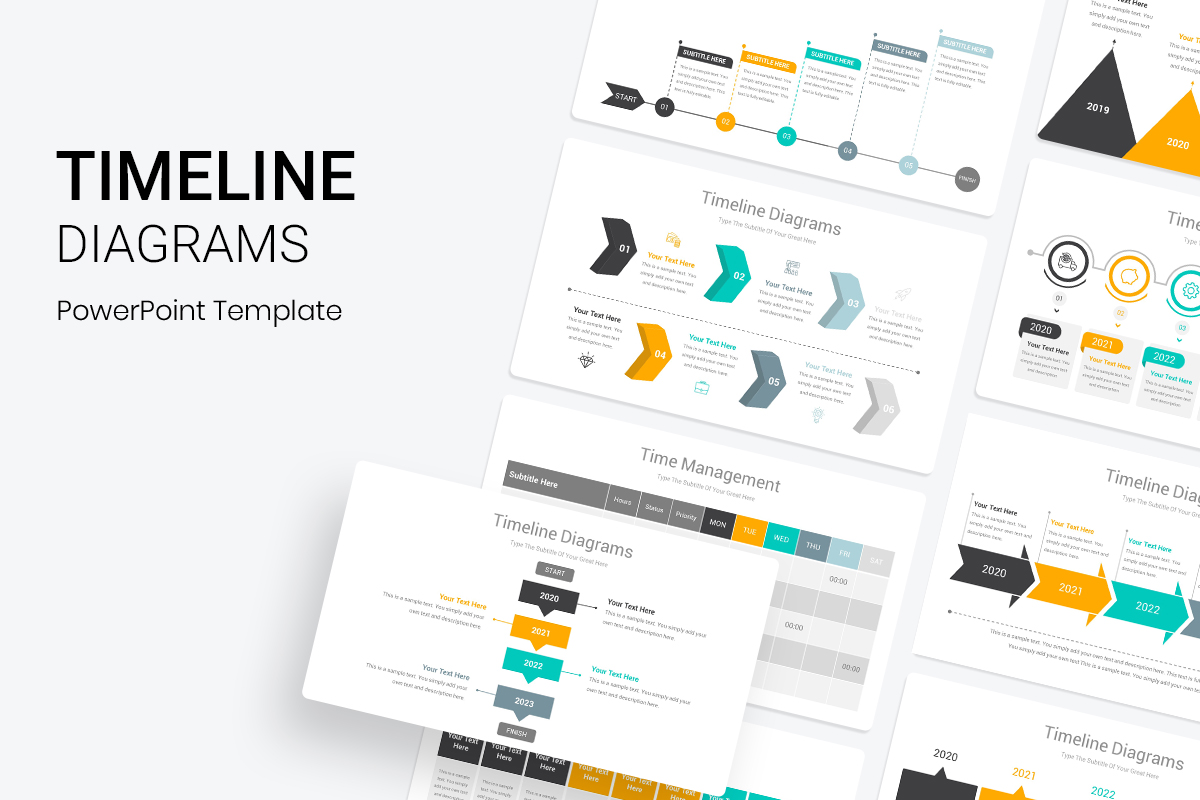
A timeline is a display of a list of events in chronological order. It is usually a graphic design showing a long bar labeled with dates paralleling it, and usually contemporaneous events. Timelines can use any suitable scale representing time, suiting the subject and data which are related to it. But in this set, you will get different shapes and designs of Timeline diagrams, no more typical presentation of a widely used tool, be creative and choose what you like the most out of a whopping 100 Timeline diagrams!
2. Project Status infographics PowerPoint Template
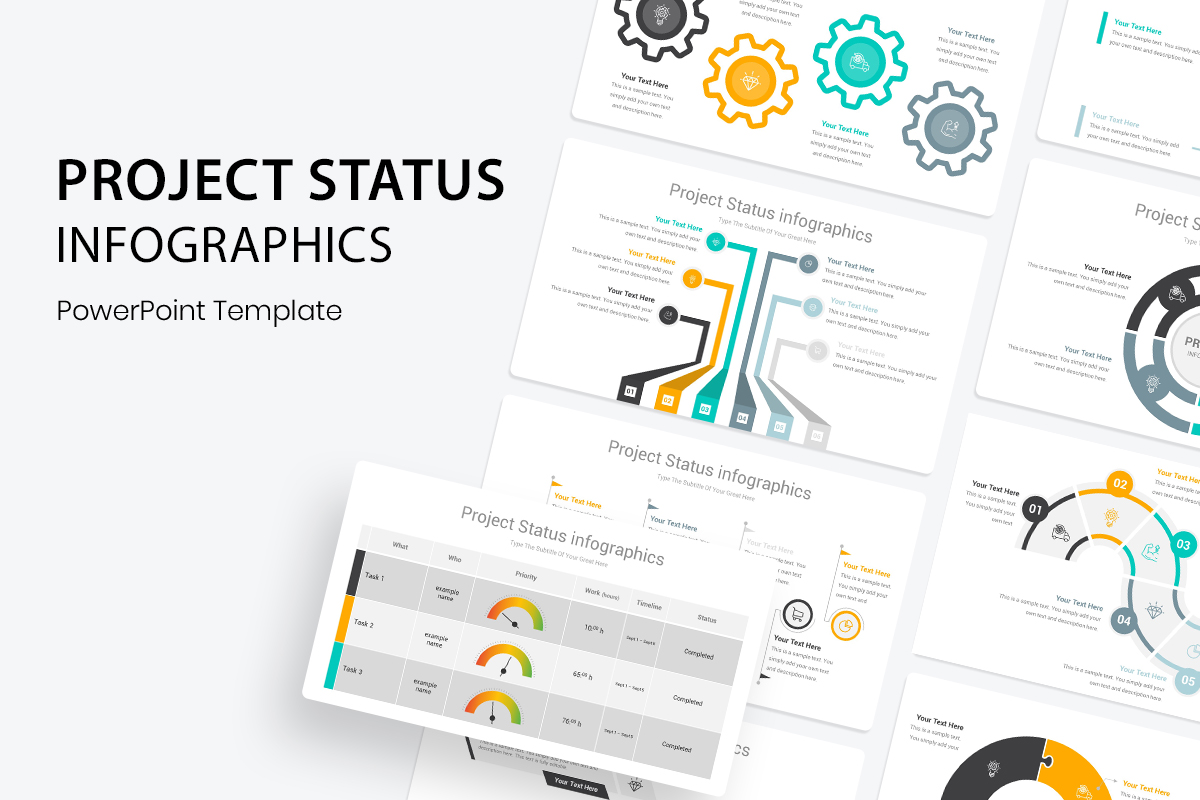
Many presentations are made to showcase the status or progress of a certain project you or your team are working on, the best way to talk about the state of this project is in no doubt Project status infographics which can separate each stage of the project into multiple phases and key points that you can highlight and show how far you have come in your project so it will be easier for you to explain and for the audience to comprehend what is really happening, and we don’t think there’s more than a 100 way (slide) to show project status via infographics.
3. KPI Dashboard PowerPoint Template
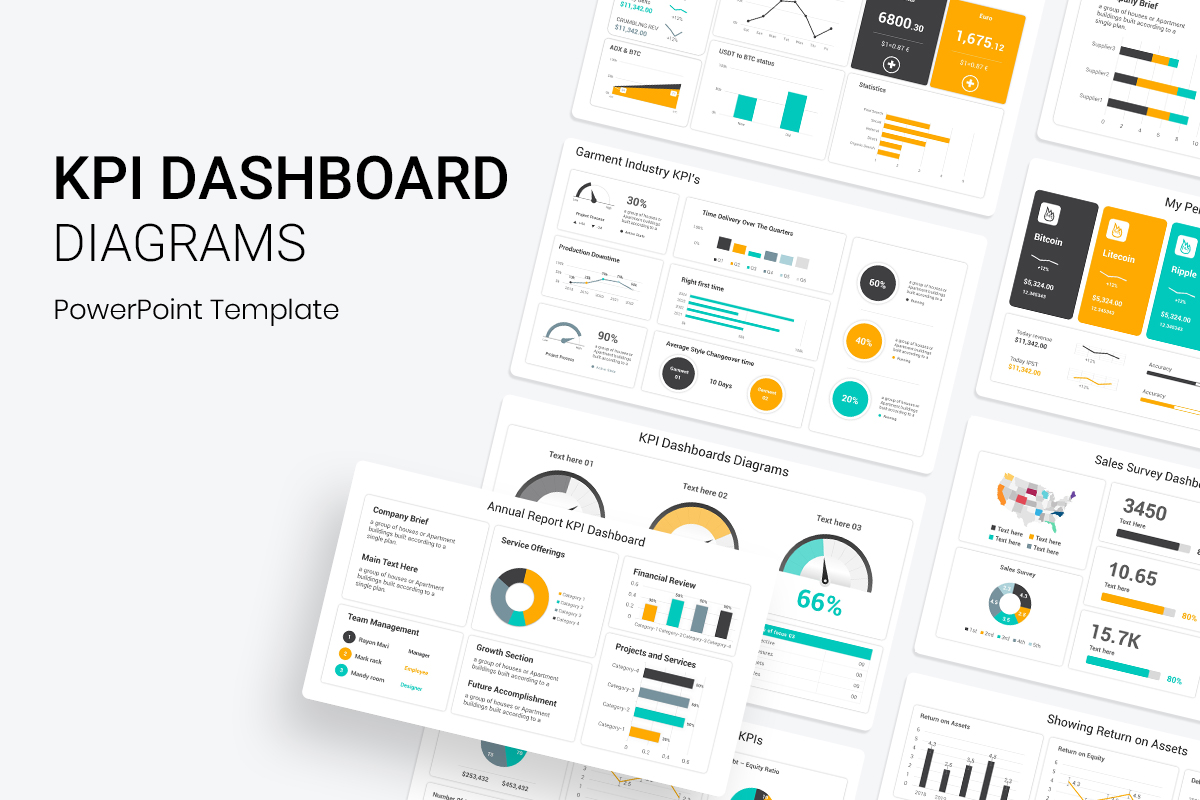
Key Performance Indicators (Or KPI Dashboard) are an important tool because they highlight the business performance of companies and individuals alike, thus organizations use them to assess their success in reaching critical goals. It is also important for KPI Dashboard to evaluate and measure the performance of employees within companies, improving and developing all internal and external operations of the organization.
There are many kinds of KPIs, such as periodical, analysis, risks, data-driven procurement dashboards, and so on, therefore they can be tricky to create, and, in this case, it’s helpful to use Nerkit carefully designed KPI Dashboard infographics.
4. Customer Journey Map PowerPoint Template diagrams
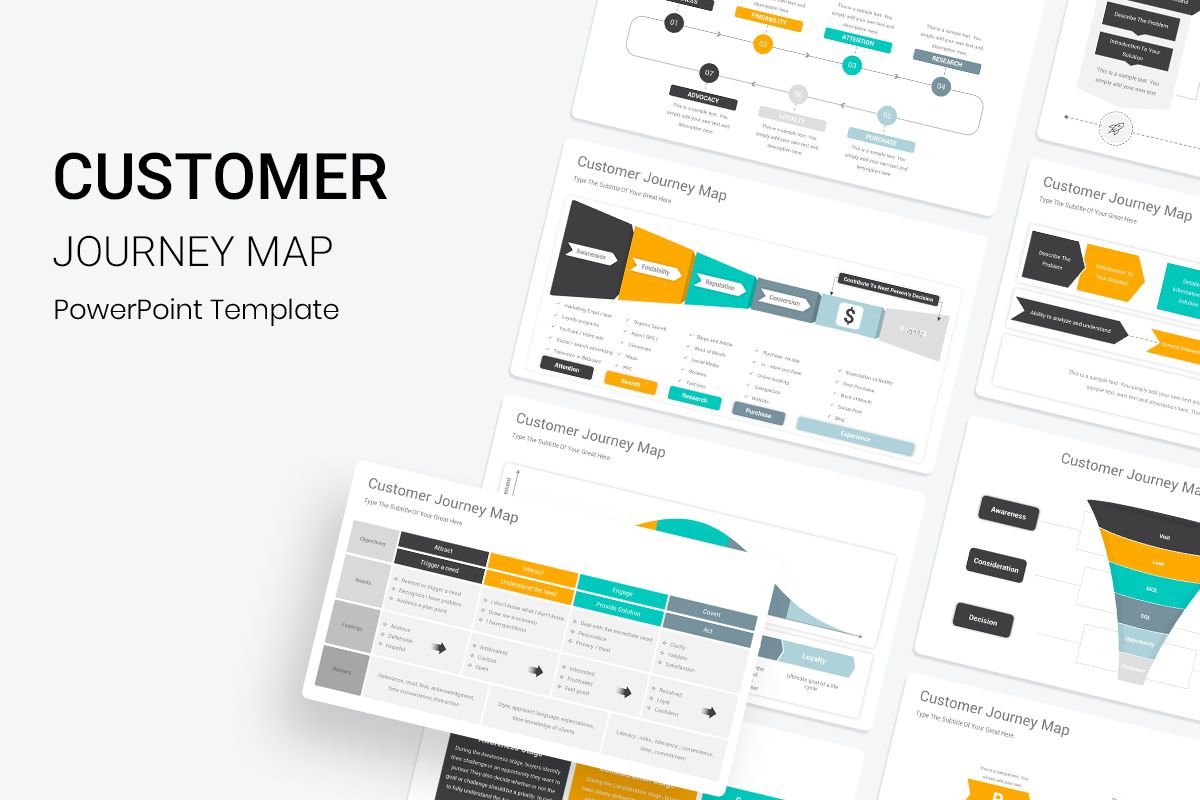
Before knowing what a customer journey map is you should know what the journey is. A customer journey is a process through which a customer interacts with a company to accomplish a certain goal. Customers usually interact with brands in many different ways. So, a customer journey map is a visual representation of a customer’s steps. It guides you through the story of your customer’s experiences with your brand. This process helps business leaders improve and personalize the customer experience. Here we back you up with 50 of the best and most used Customer Journey Map infographics out there.
5. Comparison Chart PowerPoint Infographics Template
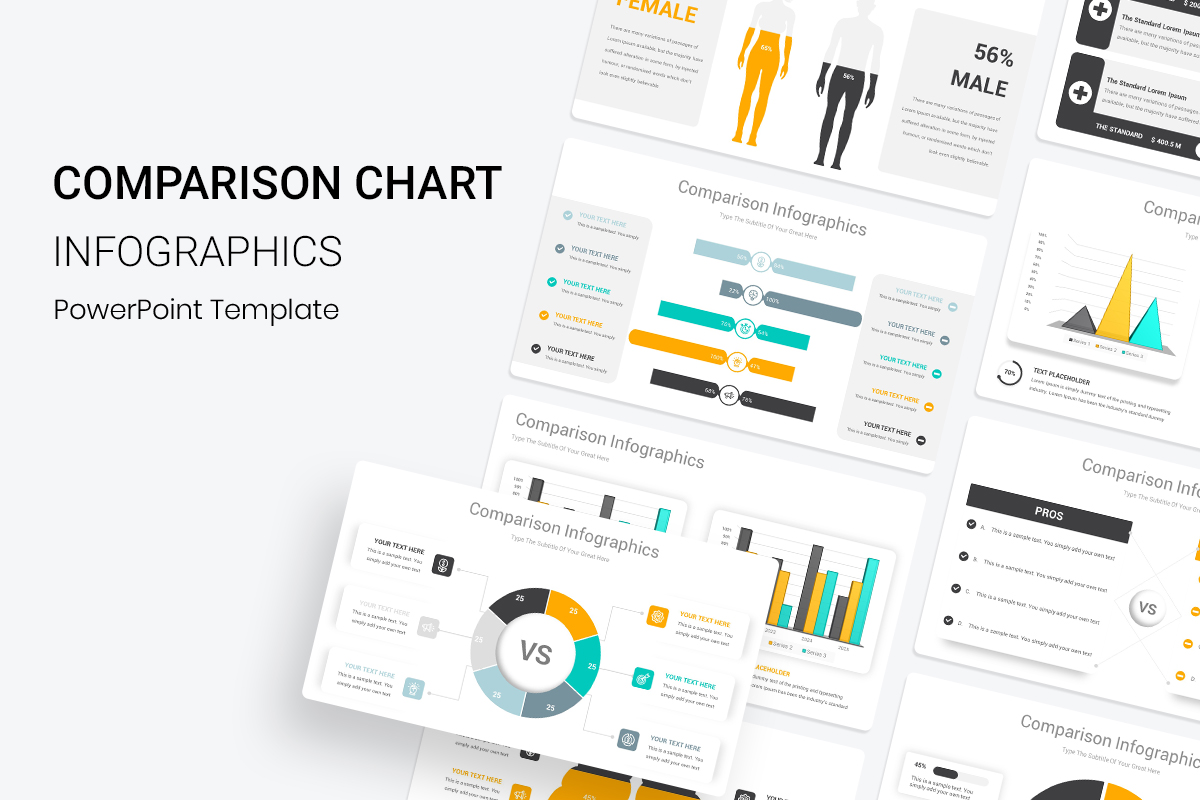
Comparison is a crucial means to show the differences between two or more sides or to list up the pros and cons of something and make understanding both sides with all their features and downsides to finally choosing one of them easier than ever. These 58 Comparison Chart Infographic templates come with editable and customizable infographic slides in just a few clicks to put and present various aspects of your marketing strategy in an inspiring and engaging way. Add the texts and images you want, beat your competitors, and make your presentation remembered.
6. SWOT analysis PowerPoint Template
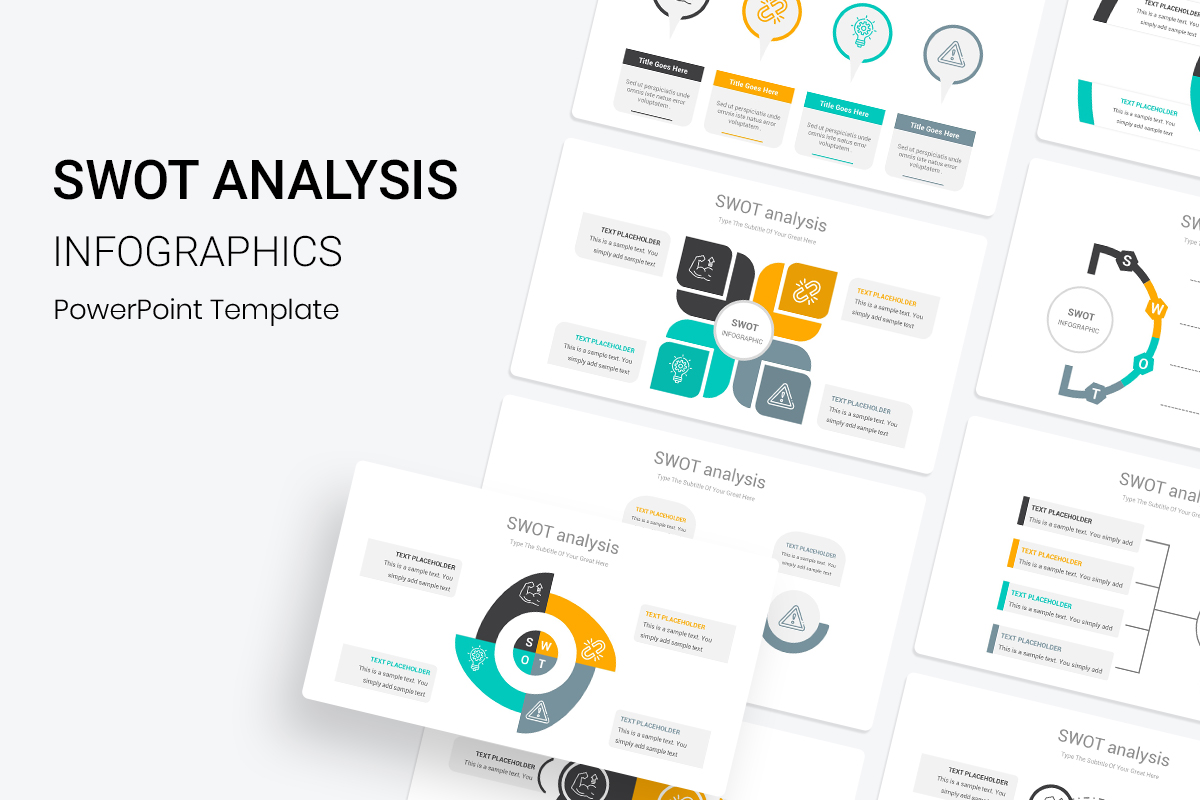
SWOT Analysis is an analysis based on a tool to analyze the personality or the analysis of the entity or the company; For evaluation and review, with the aim of arriving at a good analysis, identifying the capabilities owned by the person or the company, knowing the negatives and fading them, and developing and empowering strengths. All for the purpose of achieving competition, overcoming competitors, and obtaining future opportunities and jobs that are compatible with the capabilities and skills available. A SWOT analysis consists of Strengths, Weaknesses, Opportunities, and Threats and this template contains of 49 different SWOT analysis shapes that will satisfy your taste.
7. Process Flow Diagram PowerPoint Template
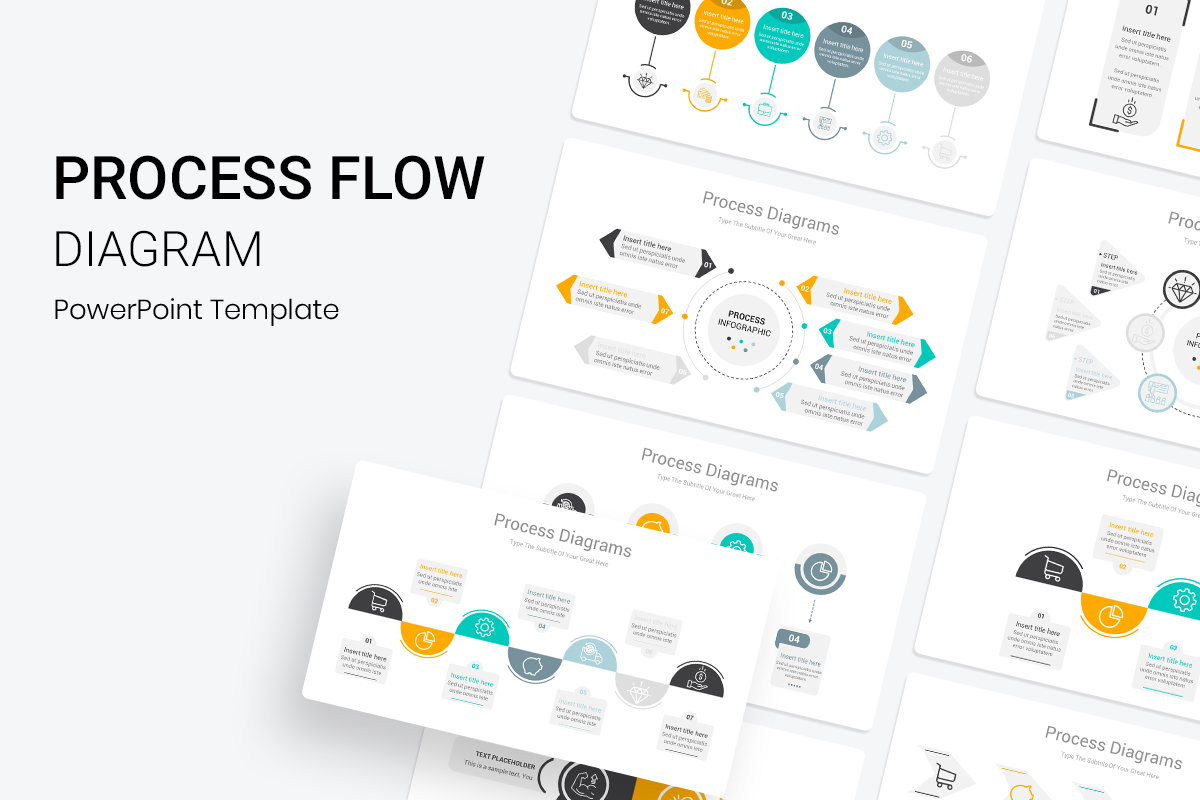
A process flow diagram (PFD) is a type of technical flowchart that represents the integrity of equipment and factory operations. This visual chart presents a link among the main equipment of a facility. However, this chart does not concern minor details, such as designations and control valves. Process flow diagrams are also relied on by business owners to record, enhance, and set up operational processes and it assists designers and managers in their process arrangements, ensuring direct outputs.
A typical process flow diagram would integrate significant datasets and comprise information about operating data, mechanical equipment, and interconnections to other systems. PFDs are very necessary during project explanations and showcases as they illustrate certain phases in a process. PFDs come in several designs suitable for certain purposes, thus we give you 79 different templates to work with.
8. Arrow Diagrams PowerPoint Template
![]()
Arrow diagrams infographics are a great tool to explain processes, developments, strategies, stages, and plans. Arrows are a useful asset to employ in any type of presentation’s needs. Arrows Infographic can be used in business to define the strategy for the company, or for educational purposes, like explaining the reasons for historical or scientific events. Arrows usually appear as paths, pointed arrows, boxes, lists, or even overlapping to form a circle, displaying up to 6 sections per slide with title, text area, and spaces for your desired icons. You’ll find different professional and modern designs of your favorite choices.
9. Mind Map Diagrams PowerPoint Presentation
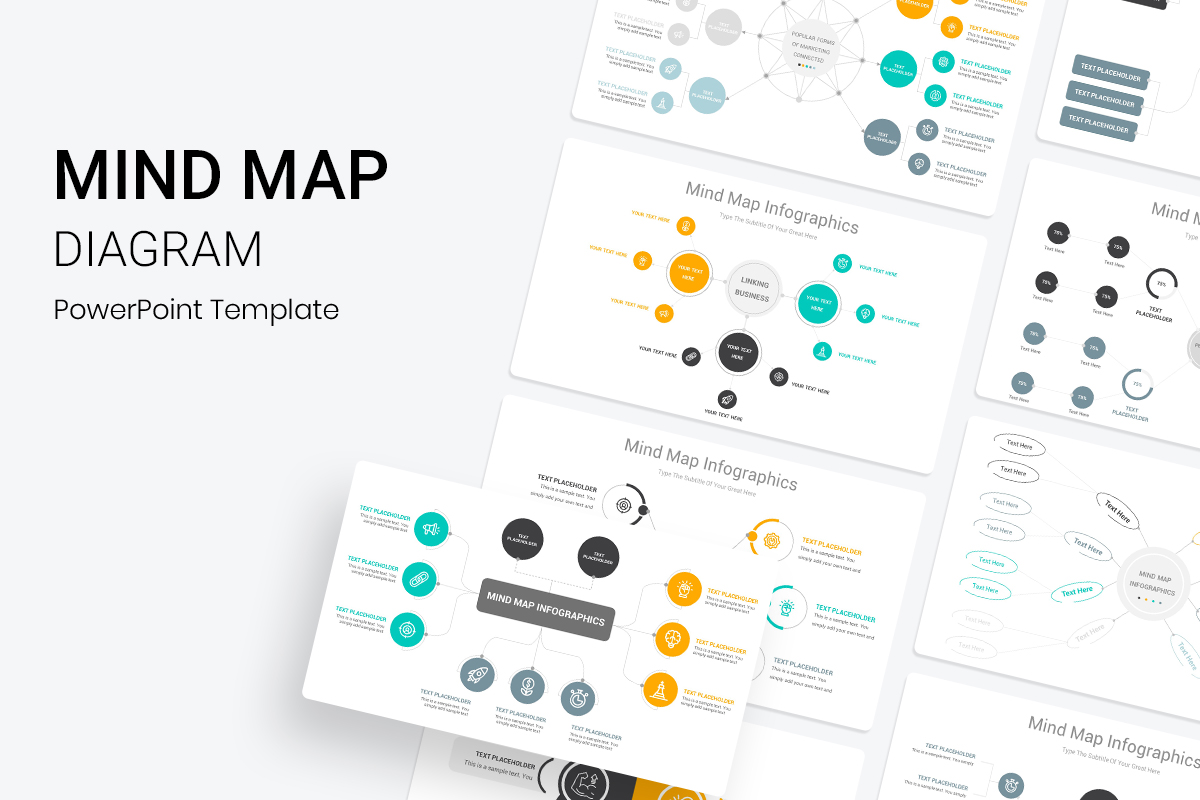
Mind maps are a relatively new way to express ideas, and a powerful graphic tool for translating what is going on in your mind into a visual presentation, that’s because the way it works is similar to the way the human mind works. Most people agree that Mind Maps are the best and most effective way to present ideas and show them in an interesting, clear, and simplified method. So if you have a huge amount of information and many ideas that you need to discuss you should think about using an appropriate mind map of the following 39 awesome Mind Map Diagrams.
10. Funnel Diagrams PowerPoint Template
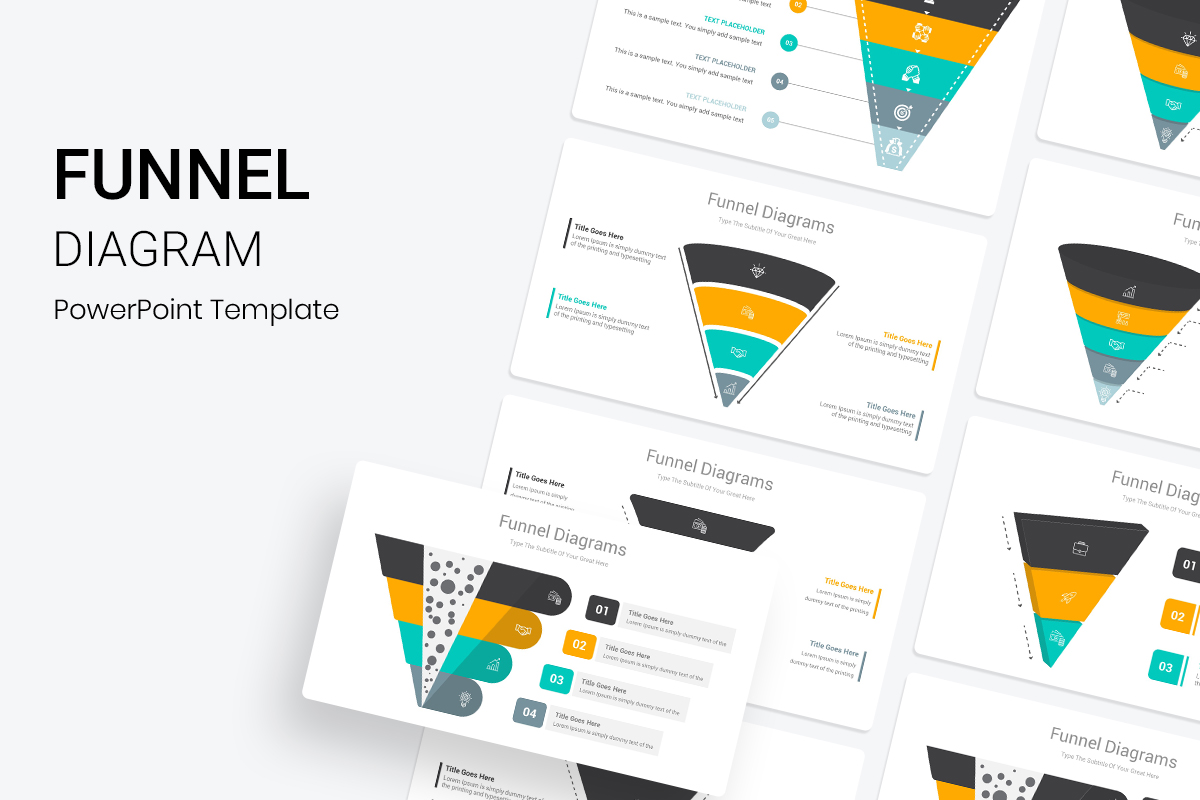
The Funnels Diagrams are designed to show how data and information transform during a process from a wide-open head to a narrow end, thus they are an important and widely used infographic especially in marketing and sales because of the unique shape of funnels that serves as a filtering processor. The funnel is represented either as rings or circles which decrease in size all the way to the bottom. The 50 slides here start with two levels up to six for complex processes. If you are in need of any kind of funnels, the template has your back to visualize conversions, buying process, customer’s acquisition process, etc.
11. Pyramid Infographics PowerPoint Diagram
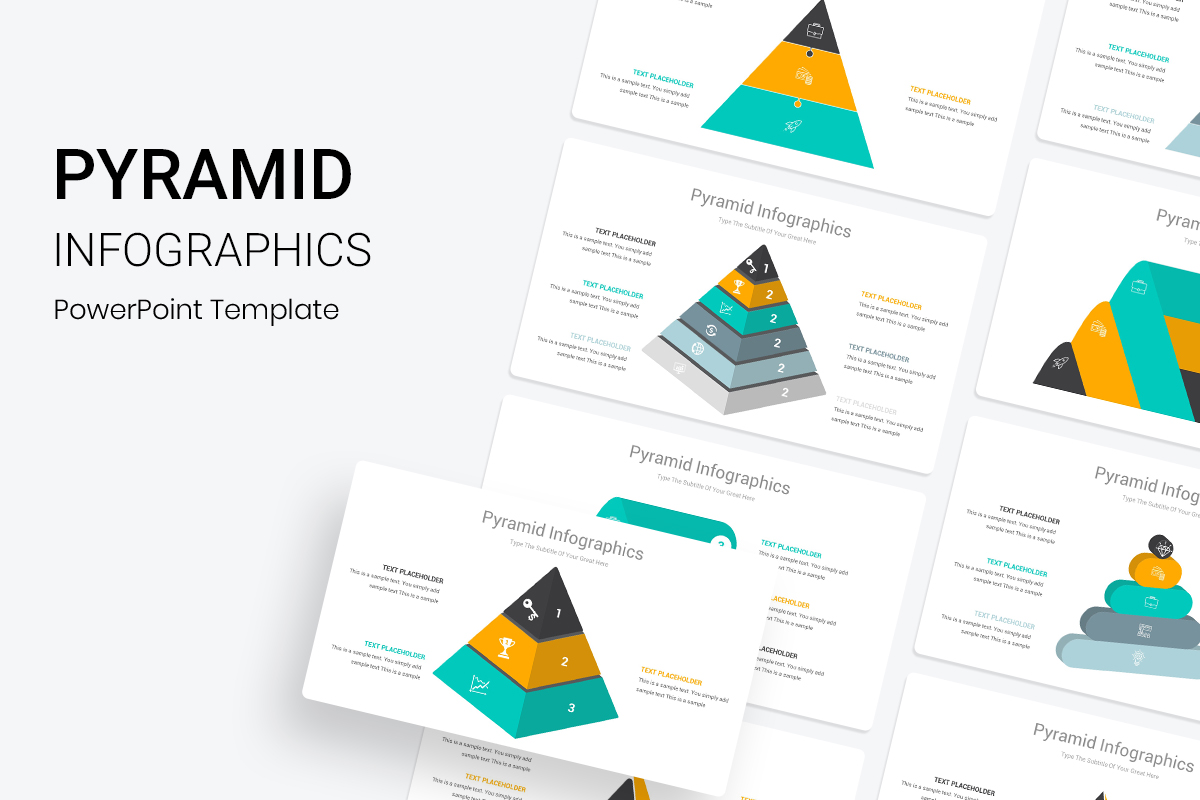
Pyramid charts are used to arrange items in a way that shows the hierarchical structure, quantity, or size, as well as introducing your team, priorities, or best sellers in a hierarchical way. This can include any progressive order such as business management positions, products sold, business locations, etc. Using Pyramid Infographics during your business presentations lets you present your information in different levels that have a subject, topic, or idea according to its level of importance in up to 6 levels with the best designs you will find on the internet. Each one of these diagrams is completely editable, so you can add your information and change the colors very easily.
12. Editable Data Charts PowerPoint Presentation Template
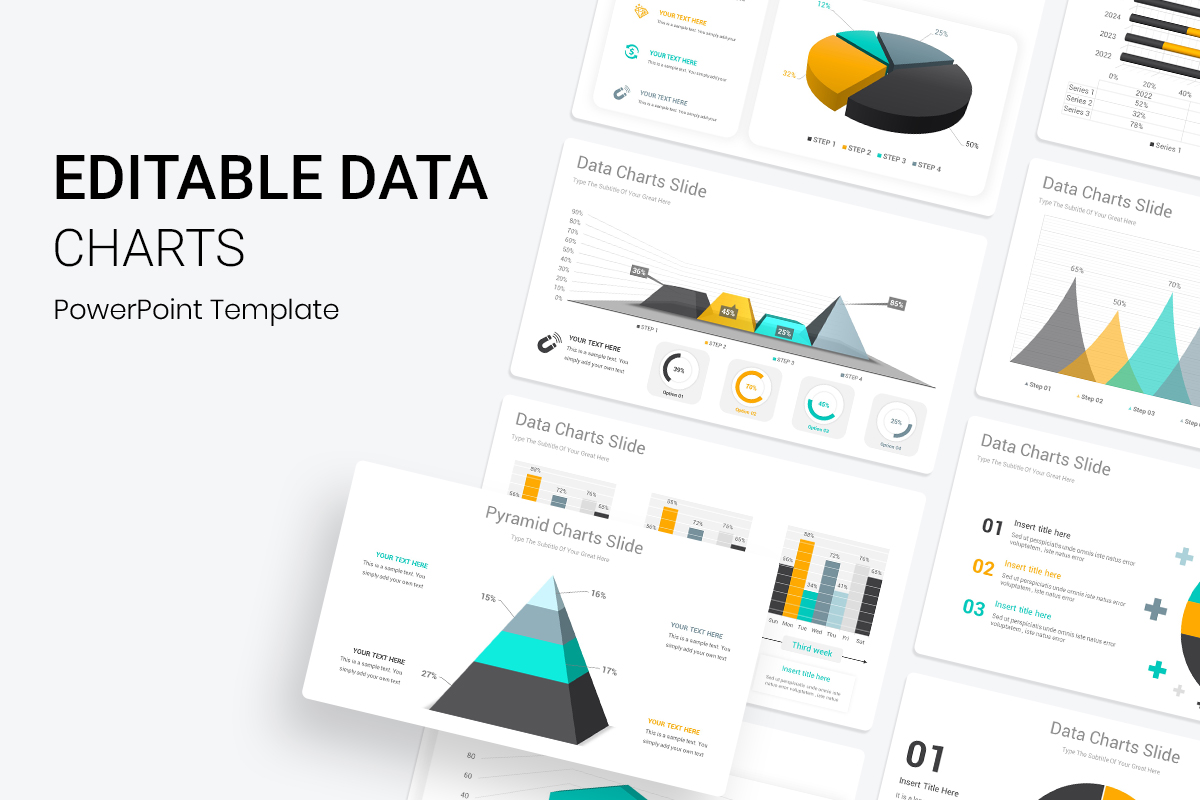
A chart is a picture, diagram, or table that organizes a large amount of data and is used to display current data and to make decisions or predictions. There are many data charts for many different kinds of purposes such as a column chart that takes advantage of the height of the column to reflect the difference in the data, A Line chart is used to show the change of data over a continuous time span, Pie Charts, Bar Charts, etc., in addition to slides dedicated to Twitter, Behance, Pinterest, and YouTube. They all can be edited and changed with one click, with a huge collection of customizable shapes and icons to enhance your presentation and grant you the ability to create the best depiction of your processes and data.
13. Business Infographics PowerPoint Template
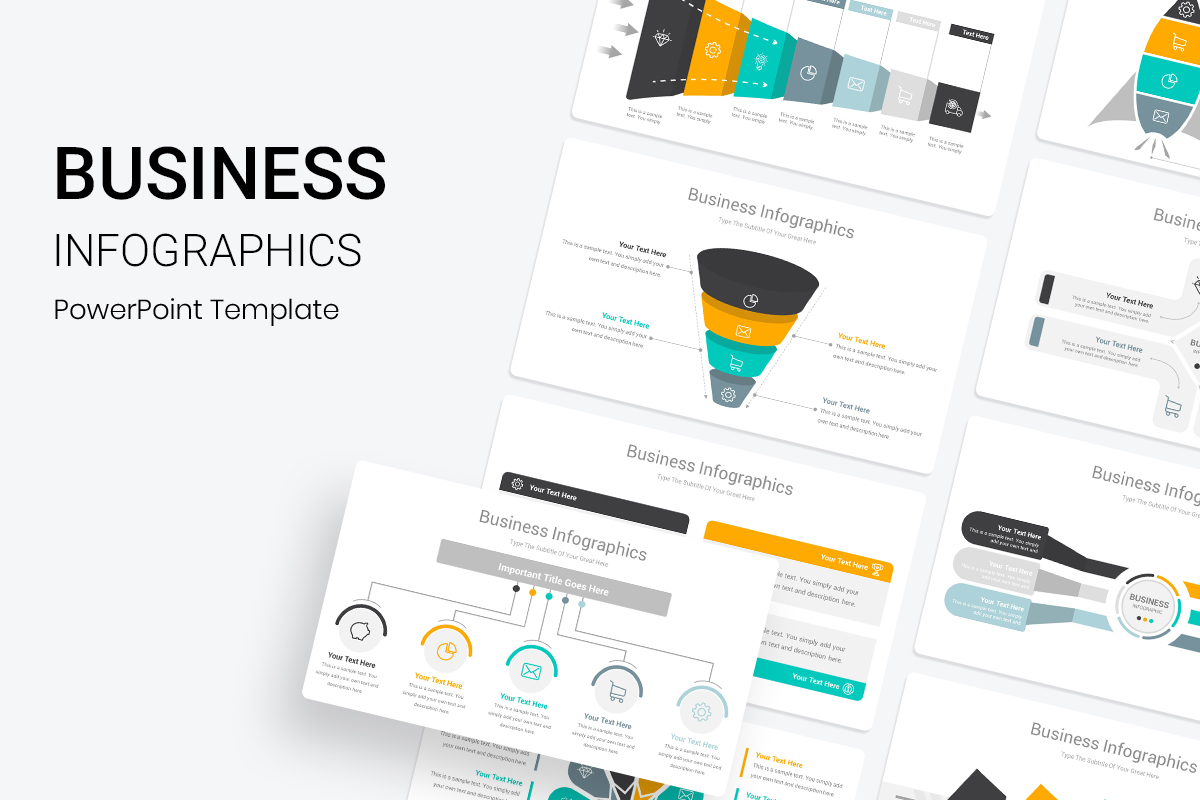
Infographics are a great and very beneficial tool for any business-related presentation because of their high capability to display content such as information, data, and knowledge in a simple and attractive way that can be easily understood by the targeted audiences. This set of 137 creative business infographics has a collection of the most commonly used diagrams and charts in the field of business and corporations and that is an essential component in any successful business presentation.
14. Puzzle Diagrams PowerPoint Template
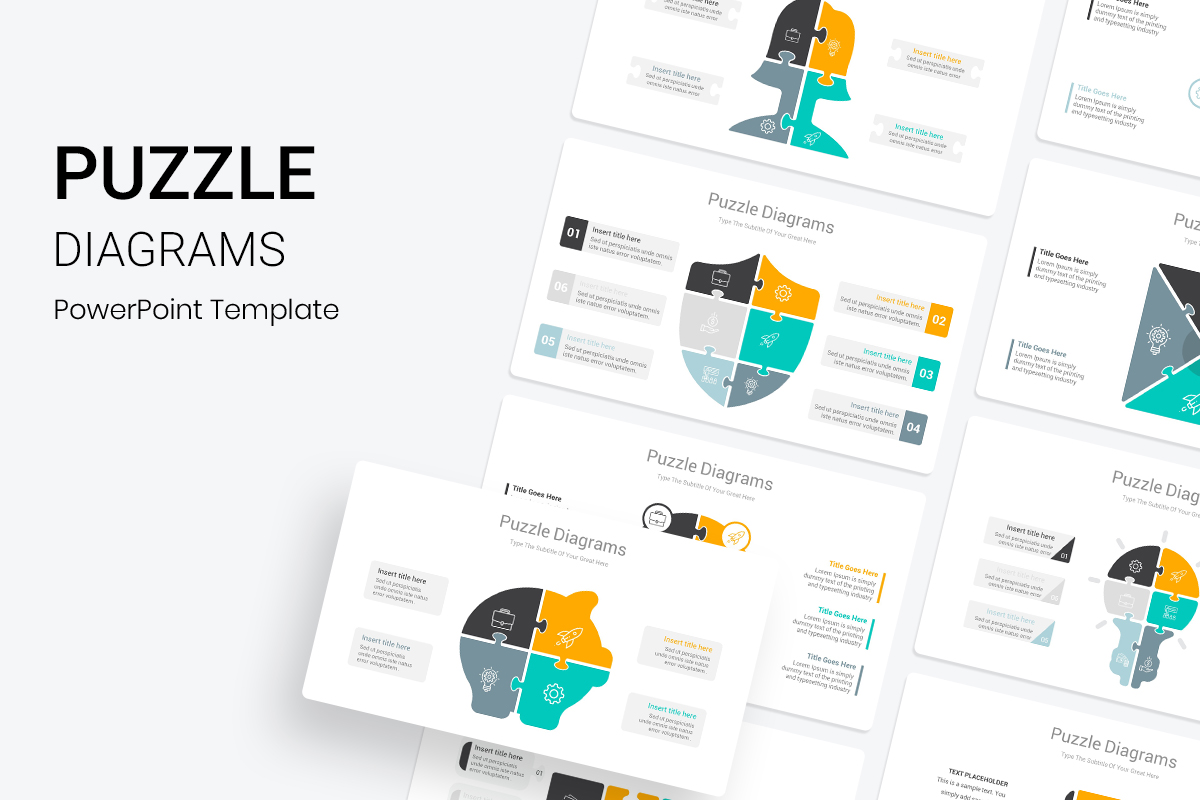
A very effective and straightforward way to create engaging visual representations in a clean and simple way is Puzzle diagrams. Puzzle diagrams give you the opportunity to catch and maintain the attention of the audience on your slides and interact with them. Thus, we provide you with more than 50+ puzzle shapes that include; suitcases, circles, triangles, shields, money bags, bulbs, and more puzzle infographics that will surely suit your taste and subjects in a handy dandy PowerPoint template that will defiantly be a very powerful tool for engaging and showcasing your ideas better.
15. Roadmap Diagrams PowerPoint Template
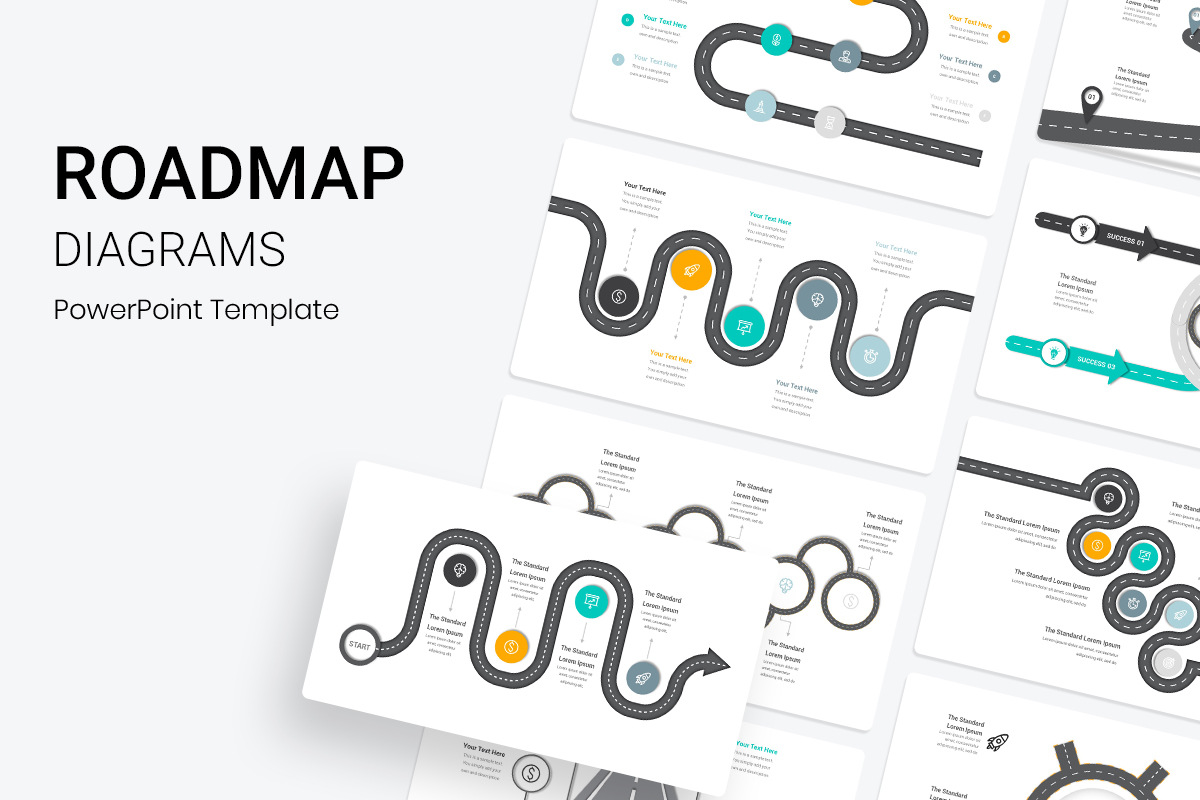
Roadmap diagrams help you map existing elements against a Timeline or certain milestones which make it useful for visualizing how a system changes over time, planning a migration of responsibility between two teams, documenting the concurrent support for multiple platforms, or representing any time-based data. Changes in the phase or state of each element can be represented in Roadmap diagrams using a dedicated notation of a bar divided into colored segments representing each state, so instead of using the old Roadmap diagrams designs try these colorful well-made 48 templates!
16. Medical Infographics PowerPoint Template
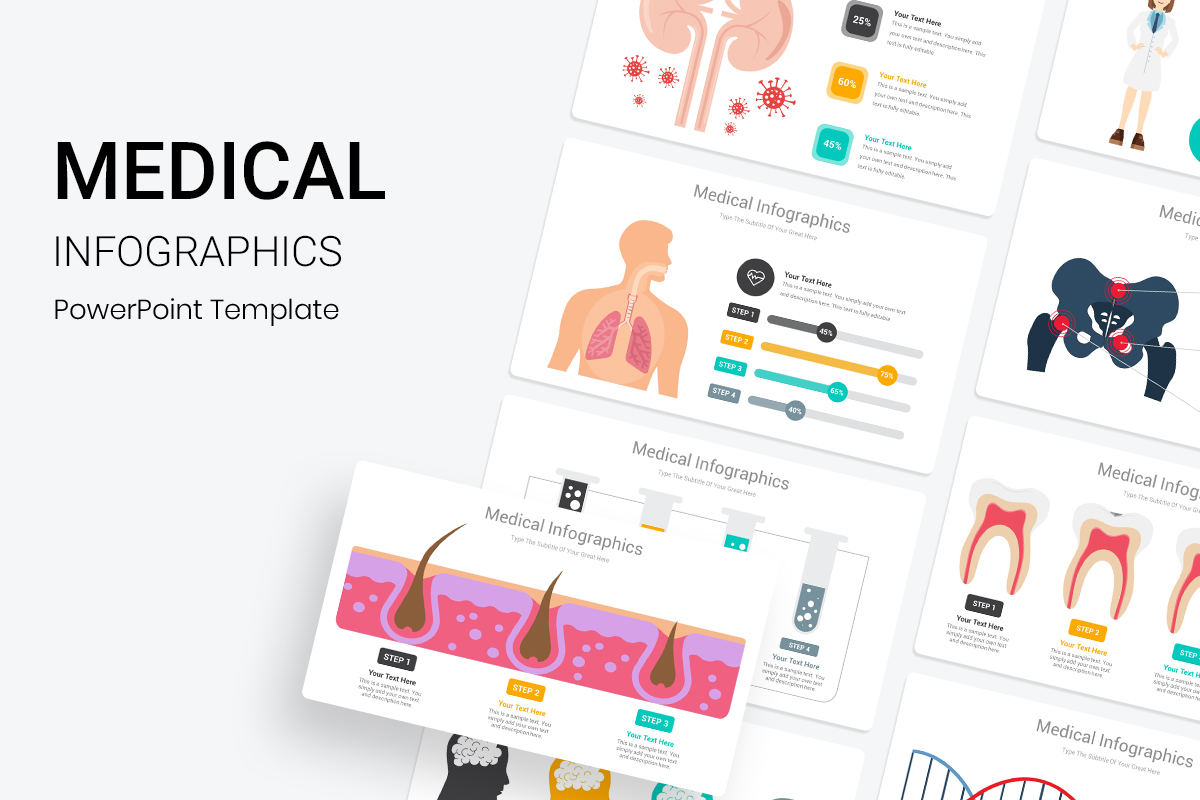
Nobody ever has expected to witness such two rough years after the pandemic made a breakthrough in the whole world, but only then we knew how medicine can save us from the horrors of illnesses and their consequences, therefore there were many educational and medical campaigns to raise awareness of the people, and in which we needed, and still need, a depictive presentation with interactive and informative slides not only to point out the extraordinary situation we went through but to cover all important-to-know diseases and make people more educated with the help of this wonderful Medical Infographics template.
17. Neumorphic Infographics PowerPoint Template
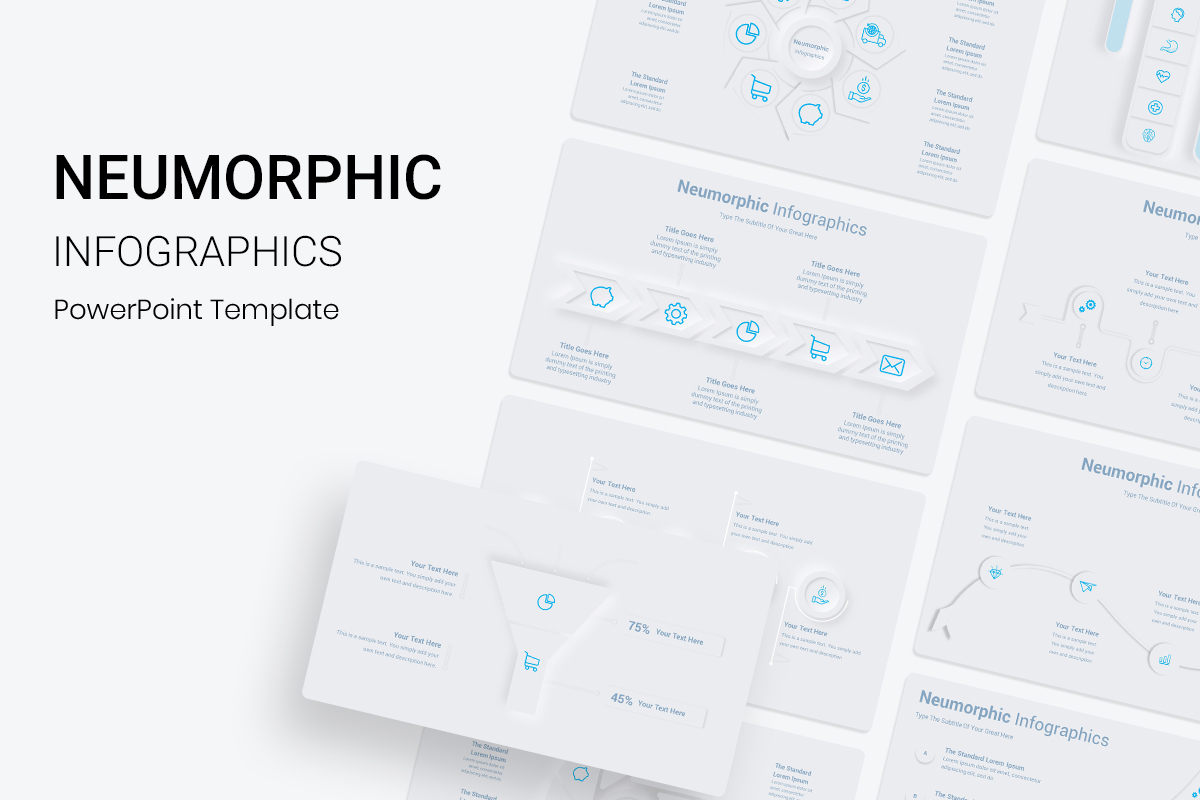
Neumorphism is a new modern graphic design technique that is a combination of skeuomorphism, flat design, and realism. Neumorphism is actually a play on words that means New Skeuomorphism, the word “Neumorphic” is a combination of two words. Neu and Morphic: Neu: New and Morphic which means a variant of Morphous, meaning having a specific shape or form. The same word was also used in an old interface design trend called Skeumorphic. So, it is trendy now again with its minimal and pale comforting color. In this set of Neumorphic Infographics slides you will find 203 different designs for all subjects and uses.
18. Brain infographics PowerPoint Template
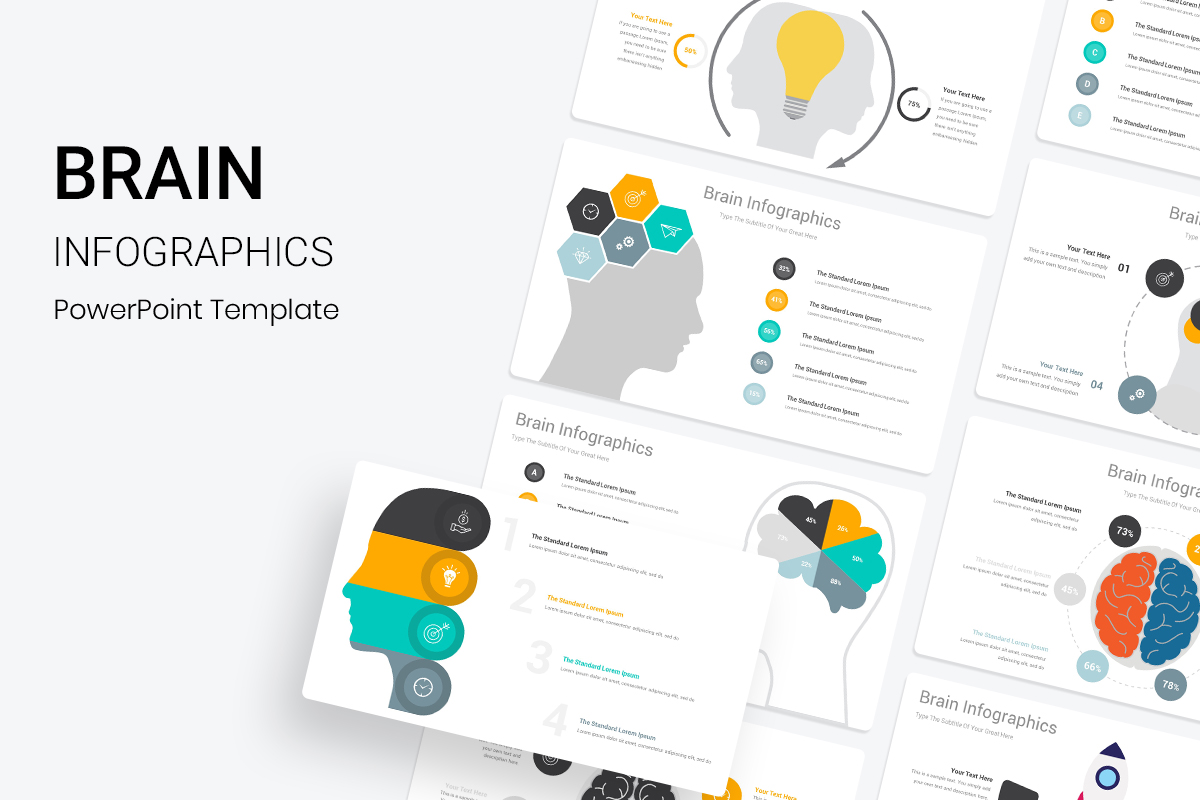
Business presentations can make good use of Brain infographics to plan, control, target, and execute a project. These graphics can also come in handy to show the profits of the project and how it affects the costumers and will benefit your business while studying the customer’s experience and journey. This information is valuable for any business that wants to improve its understanding of the customer and their experience. Brain Infographics is such an innovative and engaging way to introduce important ideas to any kind of audience. This set includes a variety of Brain Infographic templates that will help you make meaningful marketing strategies presentations easily and within minutes.
19. Goal Infographics PowerPoint Template
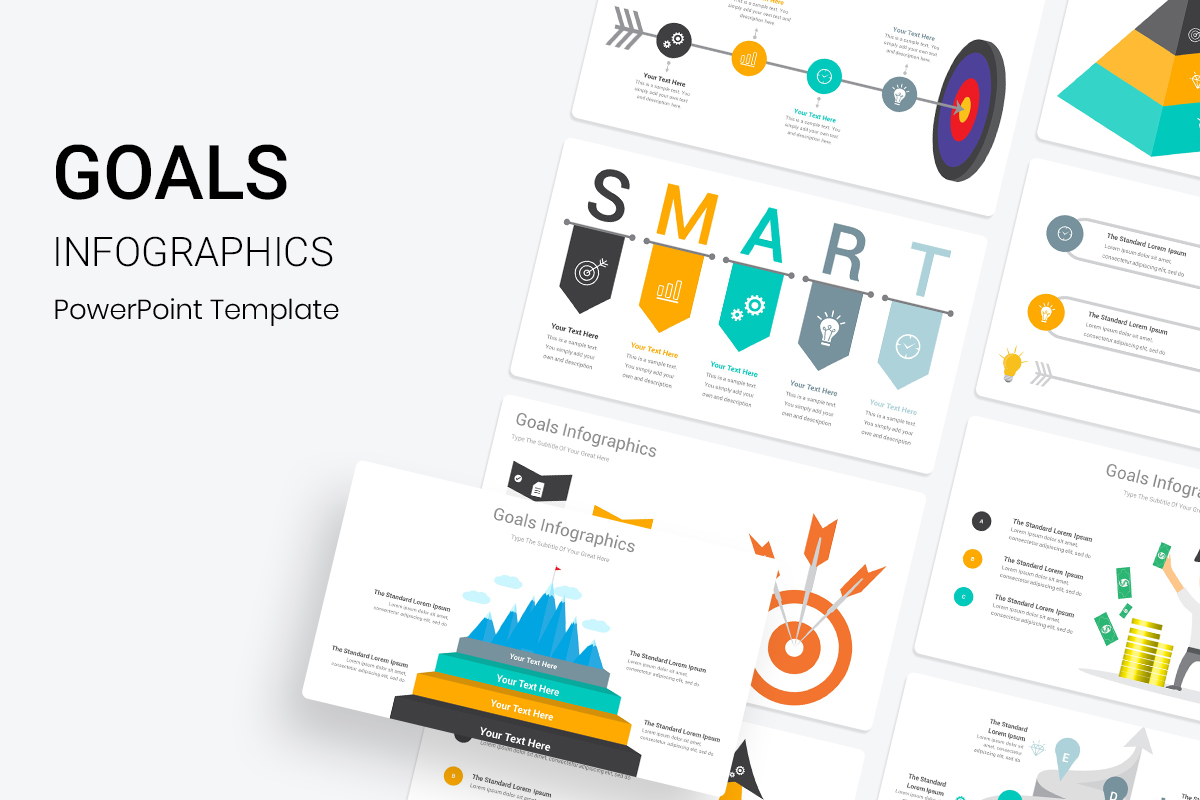
Every presentation essentially has a goal that stands ahead of it and needs to be achieved, sometimes it is obvious and needs to be discussed wide open, explained, and agreed on, the best way to do so and show directly the importance of this goal and how you intend to fulfill it is this collection of Goal Infographics templates that ranges on 65 different slides covering SMART Goals theme to at its best. No need to worry about the way you need to show your goals and means and motivations behind it when you have all the slides ready for you to fill out.
20. Venn Diagrams PowerPoint Template
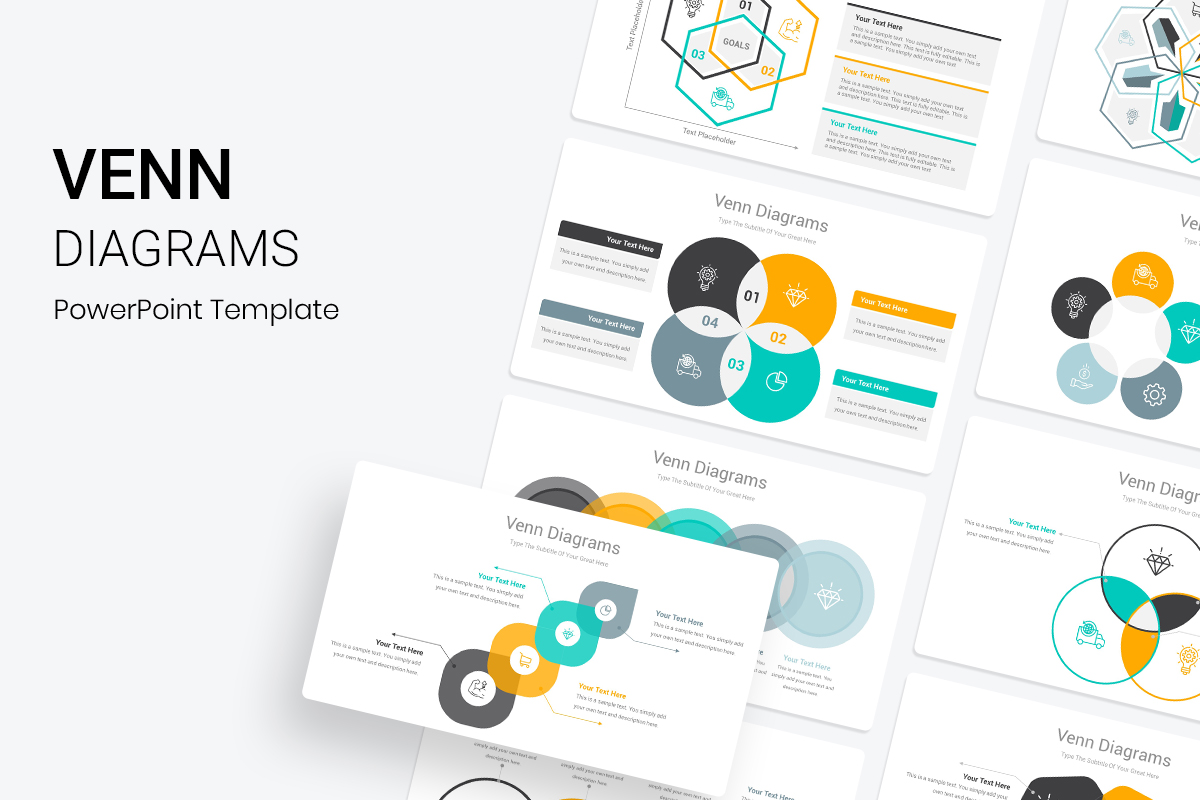
Venn diagram is one of the active learning strategies, in which circles or intersecting geometric shapes are used to illustrate logical relationships between a set of information. In most cases, the Venn diagram plays the role of a visual organizing tool by showing the similarities and differences between different information. It can be a simple diagram with only two or three groups with little information, or it can be more complex, for example in three-dimensional form and with six or more groups. It uses an art diagram to describe, and also to analyze the way information relates to each other in its own field, allowing its users to see the information in a clear and powerful manner, which makes it the ideal choice for presentations and reports.
21. Education Infographics PowerPoint Template
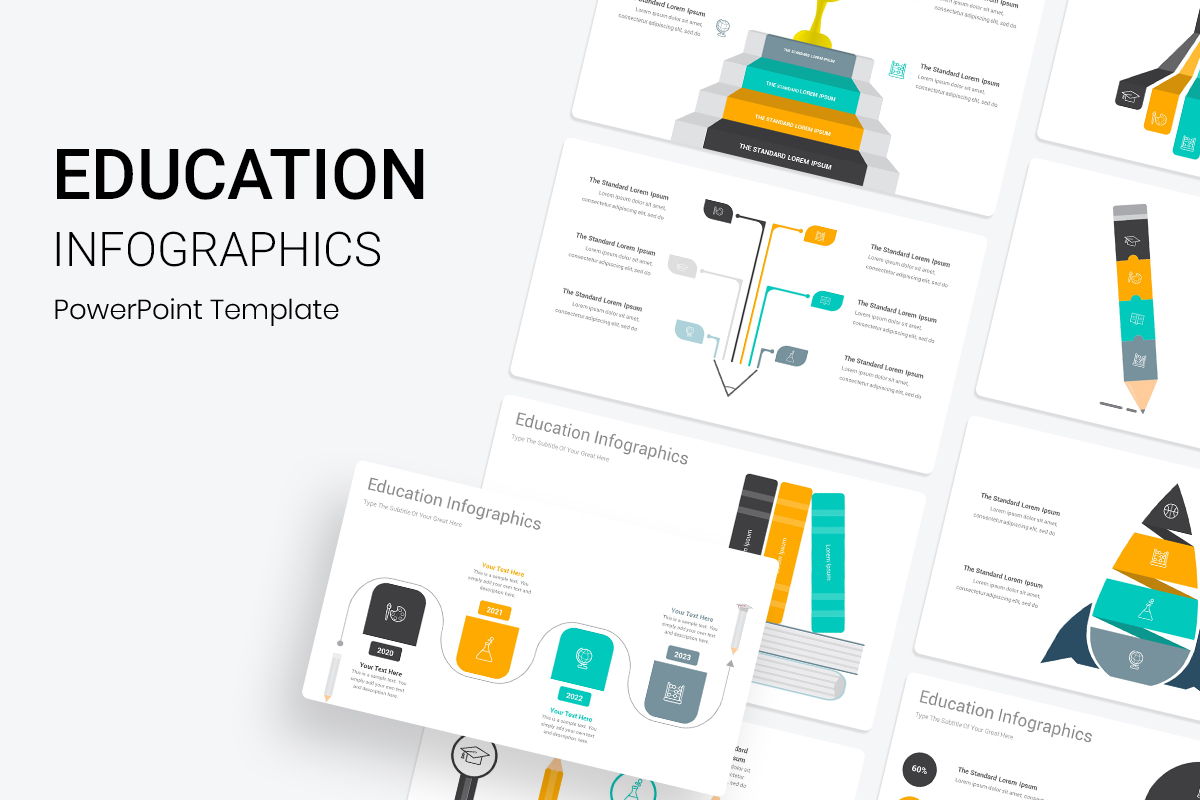
Ditch the old and boring designs that will make your student suffer to maintain focus on what are you presenting on the screen and be creative with this amazing set of educational Infographics that will help you clarify any subject very easily and smoothly with a variety of designs that work with any topic and will ensure the attention of your audience is caught up with you no matter how complicated the information was. So whether you are a student or teacher a looking for best education PowerPoint Infographics, you will find these templates of a great use.
22. Steps Infographics PowerPoint Template
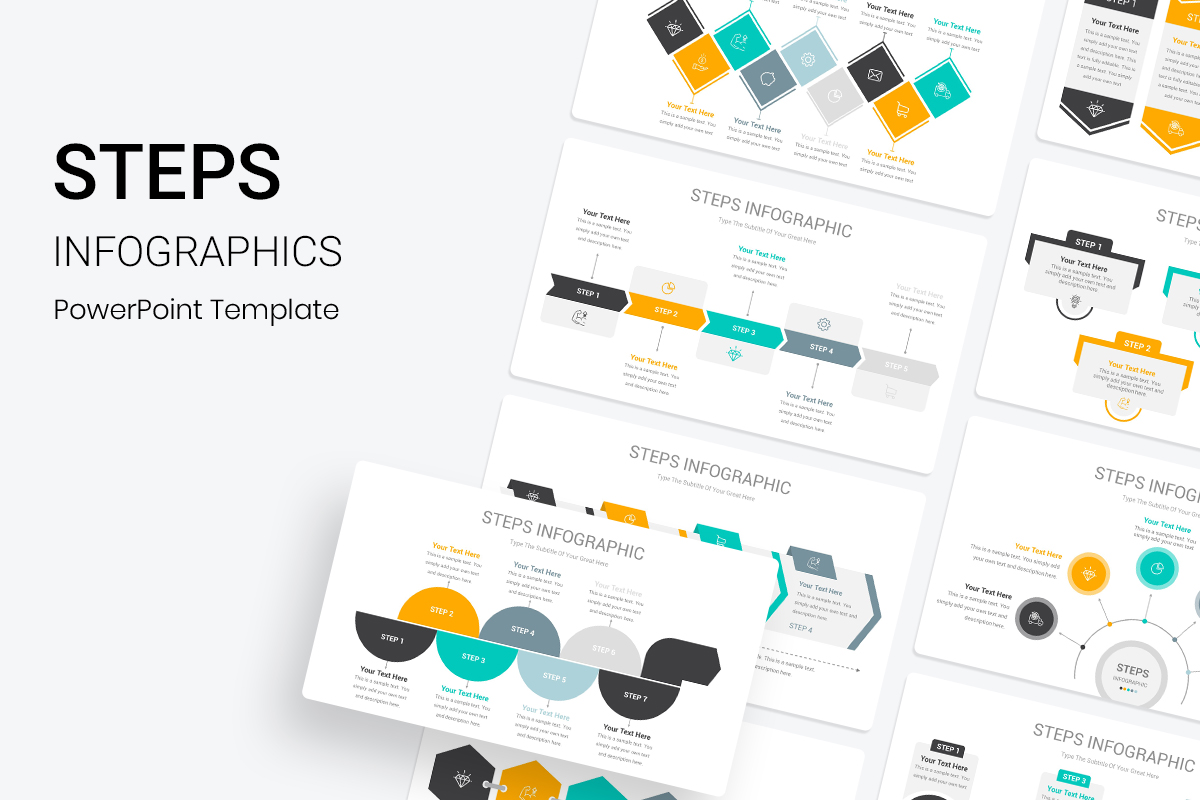
No presentation has to be complicated or overwhelming with so much text or many shapes and geometrics. It can all be summed up with Steps Infographics which can deal with any matter or topic and simplify and sort it out so clearly to understand and absorbs thanks to its organized methodology that gives priority to the content in a certain order. What is unique in this collection is the new and attractive designs used for the same purposes but granting better interaction with the attendees.
23. Business Target Infographics PowerPoint Template

Every year there is a fresh business type that appears with its special needs and prospects alongside hundreds if not thousands of new startups and expectations that need to be reflected in the right way to guarantee the desired results, thus it requires more skills than ever when working on presentations used in business meetings or company conferences to deliver the best informative experience to the targeted audience and show your ideas and aspirations in the right way using the right infographics that might be used for any intents. And although there are plenty of other Business Target Infographics on the internet, you will find nothing more elegant and easily editable like this one.
24. Folded Diagrams PowerPoint Template
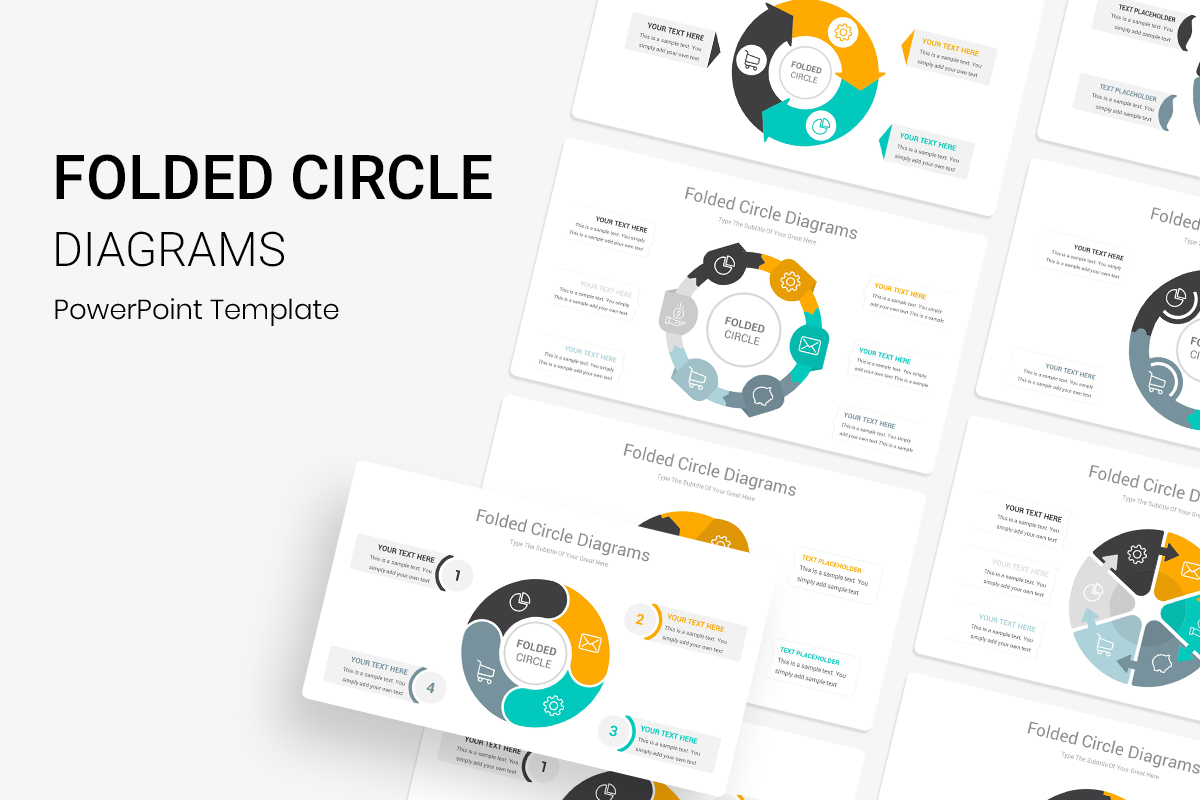
With Nerkit Multipurpose PowerPoint Infographics Template you will find one of the best sets of Folded diagrams Templates for any presentations and which can be used for a variety of purposes related to business, economics, education, etc., They can also make a very good job in illustrating business and manufacturing processes, a sequence tied to the marketing, chain of events, sales and so on all in 75 Folded circle diagram slides that range between two-part up to six in a diversity of beautiful designs.
25. Gear Diagrams PowerPoint Template
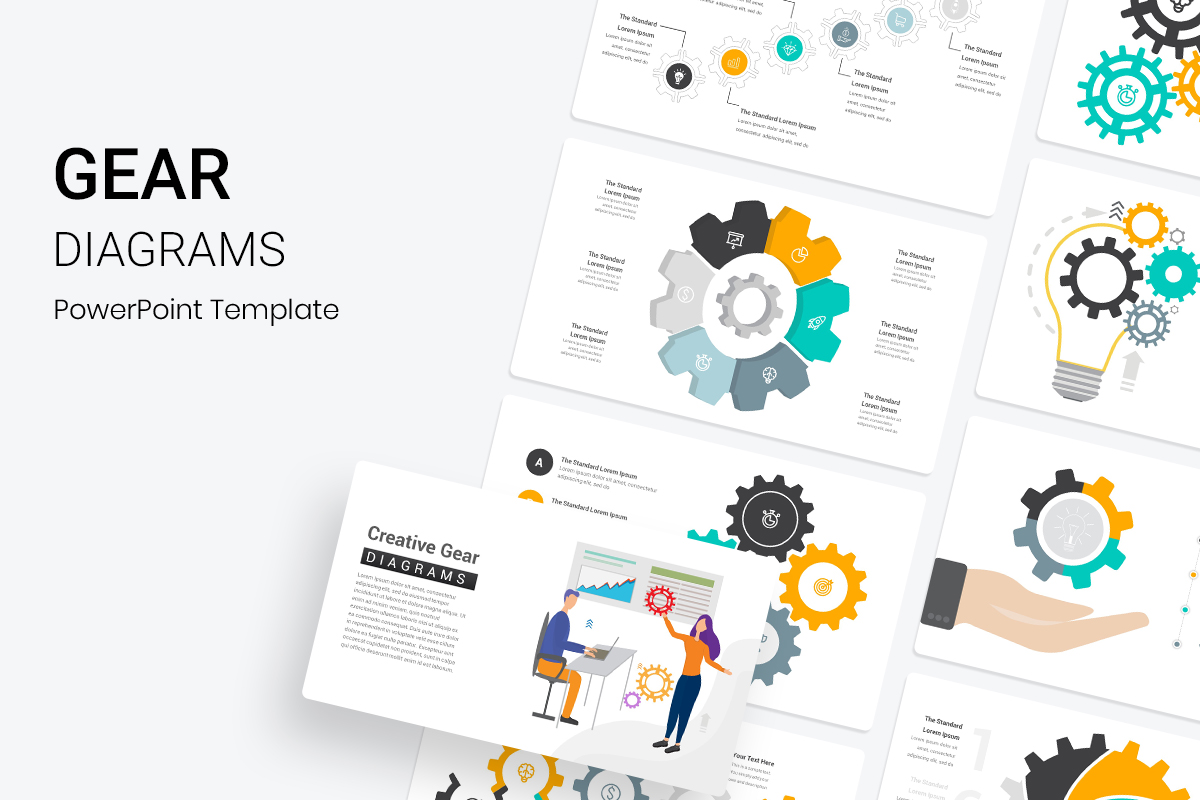
Gear diagram is used to show interlocking ideas, illustrating business, engineering and construction themed concepts, as well as representing relationships and processes between two or more related elements or ideas that are affected and moved by each other or even, like in this set of gear diagrams, consist one big gear, or process, to work properly and in a harmony. Use these templates for the best representation of the helpful use of gear diagrams!
26. Digital Marketing Infographics PowerPoint Template
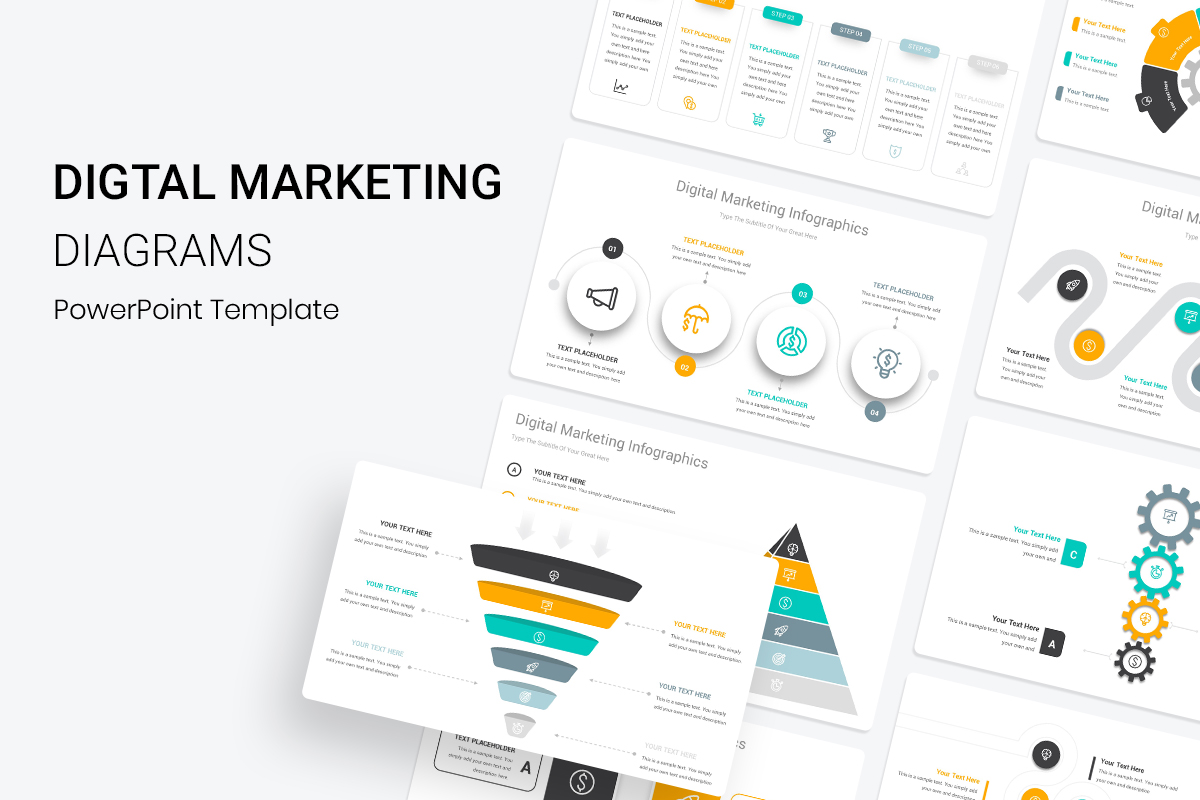
Digital marketing has proven its importance during the last decade in increasing sales of a particular product or raising awareness about a specific brand because of its features that give it an advantage over marketing in its traditional forms. For example, but not limited to, the low cost and the multiplicity of methods and strategies that can be followed to achieve better results, as well as directing and following up on marketing campaigns with the possibility of targeting the audience in a very specific and accurate manner according to the requirements of the marketer. This set of Digital Marketing Infographics covers all those aspects!
27. Circle Infographics PowerPoint Template
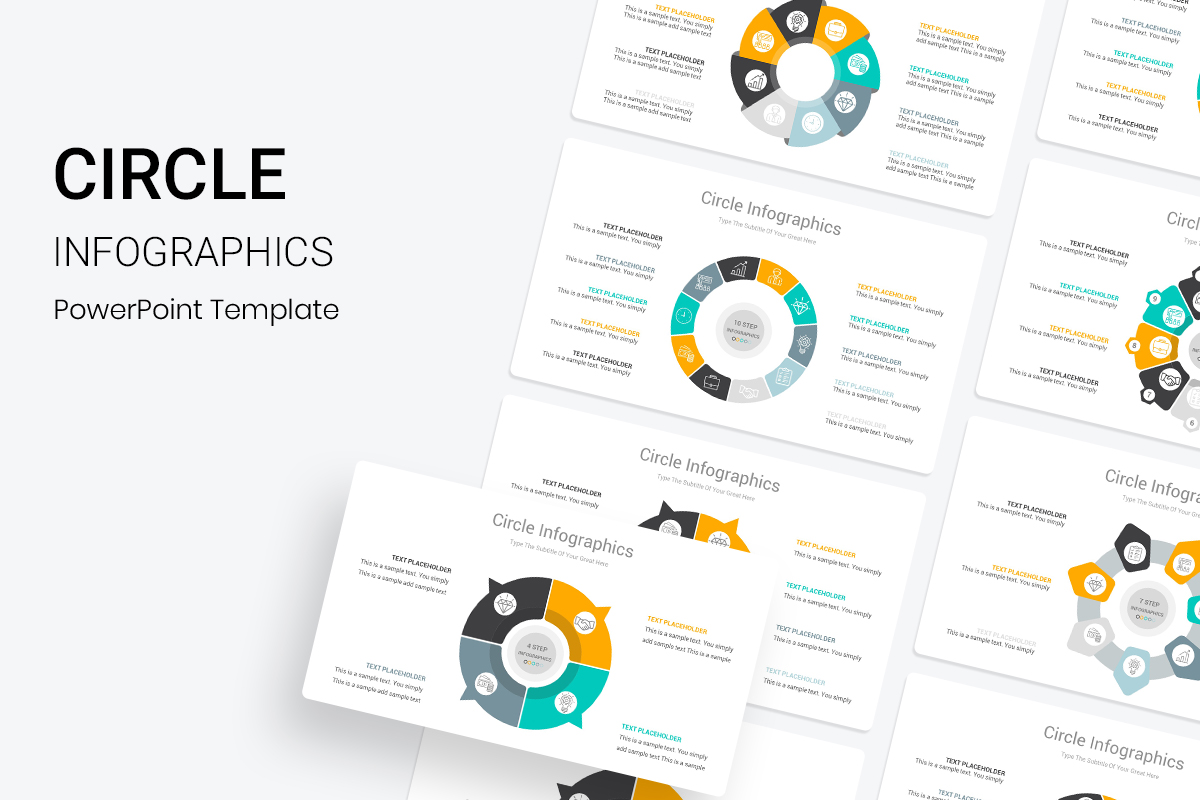
A wonderful collection of Circle Infographics that vary in designs and colors to satisfy any user who is up to make an important presentation with these neat shapes that will please any audience for sure. Circle Infographics are very commonly used as a marketing tool for anyone who wants to demonstrate how the process is working and engaging while simultaneously as well as management, relationship, and development. It’s also ideal to represent workflow relationships, project stages, development processes and can showcase a sequence of tasks or related elements to describe business concepts like management structure, business growth, and progress.
28. Geometric Infographics PowerPoint Template

Geometric Infographics are a great way to organize and enhance the look of the content in any presentation with all shapes that range across triangle, rhombus, pentagon, hexagon, octagon, and so on, in addition to circles, squares divided into several parts, cones, and other shapes that will help you organize ideas and enrich your presentation slides in the best possible way so that you get all the attention of all attendees and ensure that they fully understand what you are trying to communicate. Try this excellent collection of Geometric Infographics to impress the audience with its elegance.
29. Maps PowerPoint Template
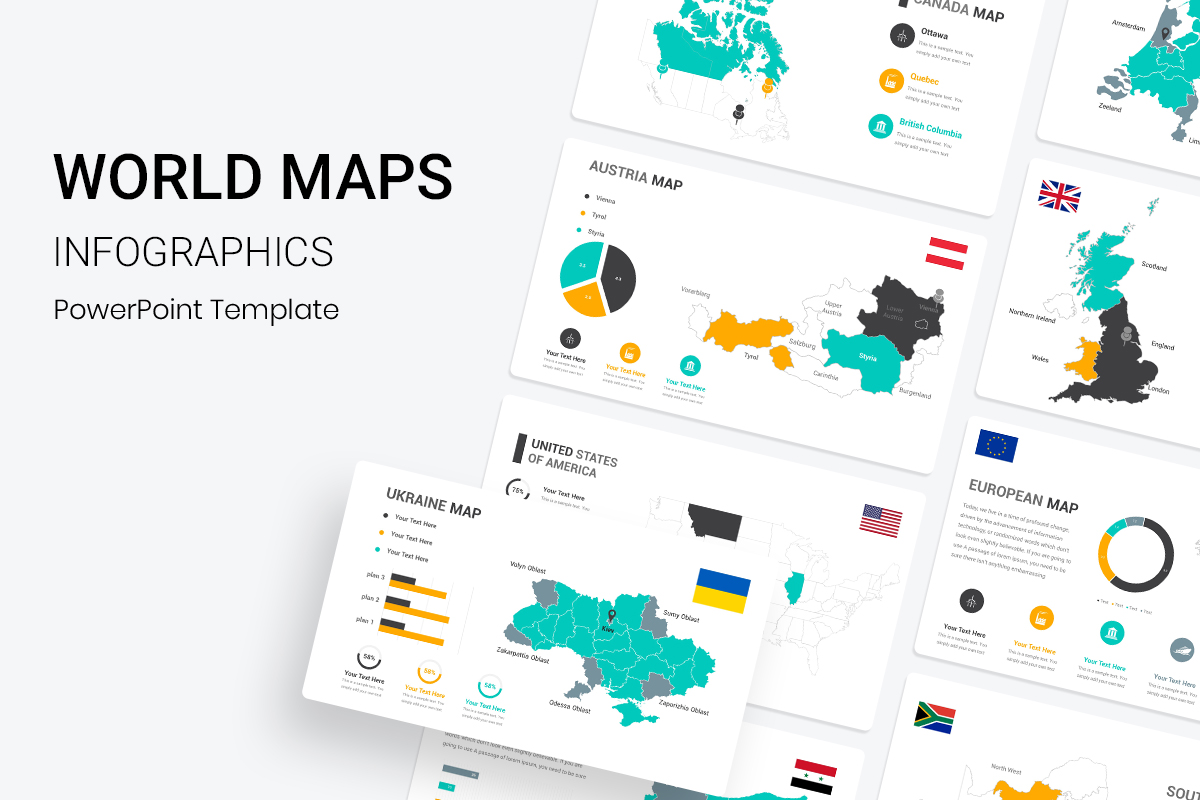
Maps are a very useful tool for telling visual stories and presenting information about the world parts in a simple way. A map shows the sizes and shapes of countries, illustrate how locations around the world are connected, and indicate the distances between different places. Maps can display Earth and countries’ distributions, revealing global route for travel logistics, or presenting geographical statistics in an appealing way. With the most important countries in the world, as well as continents, a put in convenient slides ready to be filled up with, for example, the information of the expansion of your company into new countries or your products’ trade routes or geographical locations for your organization or any other purpose you have.
30. Mockup PowerPoint Template
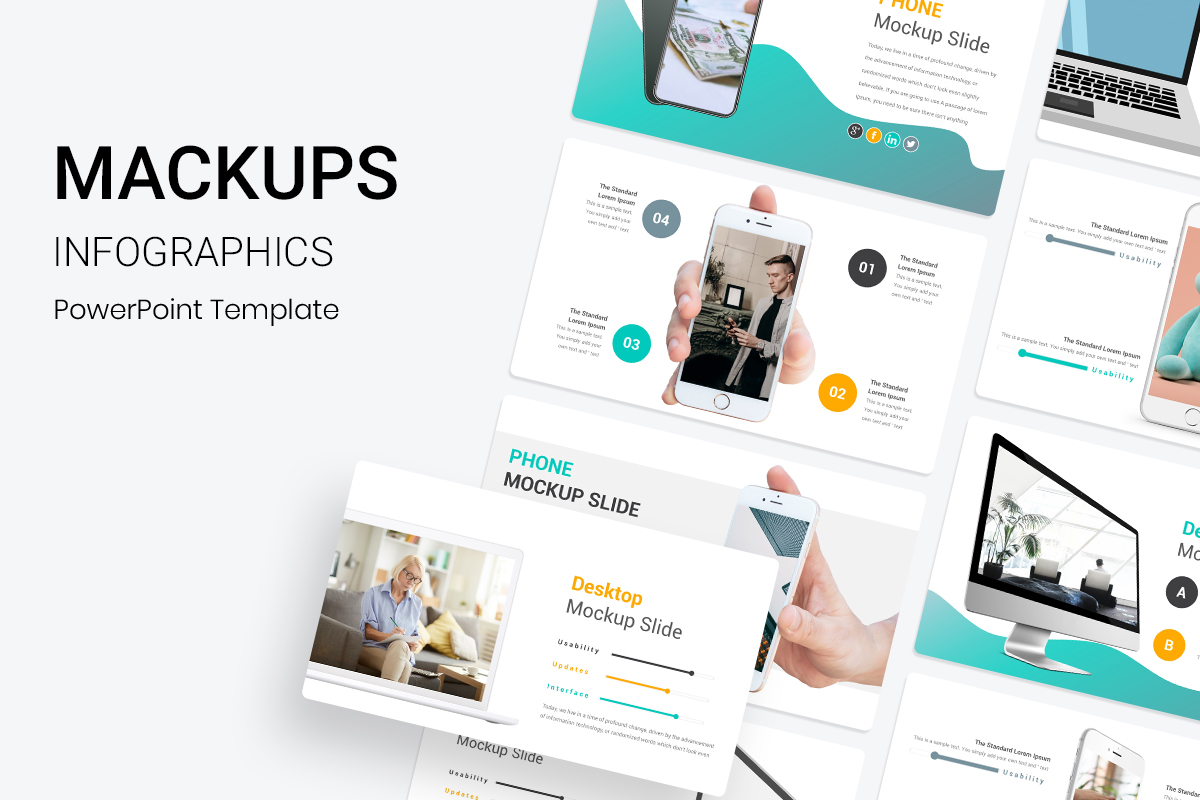
A mockup is a file that you can modify only to use a project or view a project, and in other words, it is a frame that you can add your images that you designed on it in order to display it to the public or companies to be in its final form, and a mockup has many forms such as Phones, laptops, cups, smart watches, and many other things that you can use to show how your final product will look like in your major presentation. All the essential mockups are included with very elegant backgrounds and design to save you all the time and money you would spend on other separated and expensive sets on the internet.
The content of Nerkit – Multipurpose PowerPoint Infographics Template is specially packed all together to provide a complete and integrated experience with Best PowerPoint Infographic Templates with more than 2050 infographic slides such as timelines, steps, maps, KPI, gears , medical and much more all are designed by professionals to help you creating any kind of presentations fast and easy, with a lot of customization options, not to mention that the elements are vectors objects, which are fully editable, all icons are smart object and vector which means you can easily change their size and colors to any size you want without losing resolution. All templates are modern and ready to download and start using immediately to ensure an amazing presentation next up.